
2Q 2026 Review and Outlook
U.S. equity markets delivered strong results in the second quarter with the S&P 500 gaining 15.2%. Much of the market's advance was driven by continued enthusiasm for artificial intelligence (AI), particularly among semiconductors, memory, and data-center infrastructure companies. Technology, Industrials, and Healthcare were the strongest performing sectors, whereas Communication Services, Energy, and Utilities finished the quarter with negative returns. The "Magnificent Seven" as a group lagged the broader index. In fact, Alphabet (GOOG/L) was the only member of the group to outperform the S&P 500.
Interest rates were generally up during the quarter. Short-term rates remained relatively stable while intermediate and longer-term Treasury yields moved higher, resulting in modestly positive returns on a total return basis. Municipal bonds fared slightly better. The Federal Reserve also entered a new chapter as Kevin Warsh assumed the role of Chair, succeeding Jerome Powell following his eight-year tenure.
Commodities, particularly oil, were a major market theme. West Texas Intermediate (WTI), the U.S. crude oil benchmark, began the quarter above $100 per barrel, swinging wildly in a volatile trading range before ending the quarter below $70 per barrel. Gold prices fell approximately 14% as inflation concerns eased and the U.S. dollar strengthened against a basket of major international currencies.
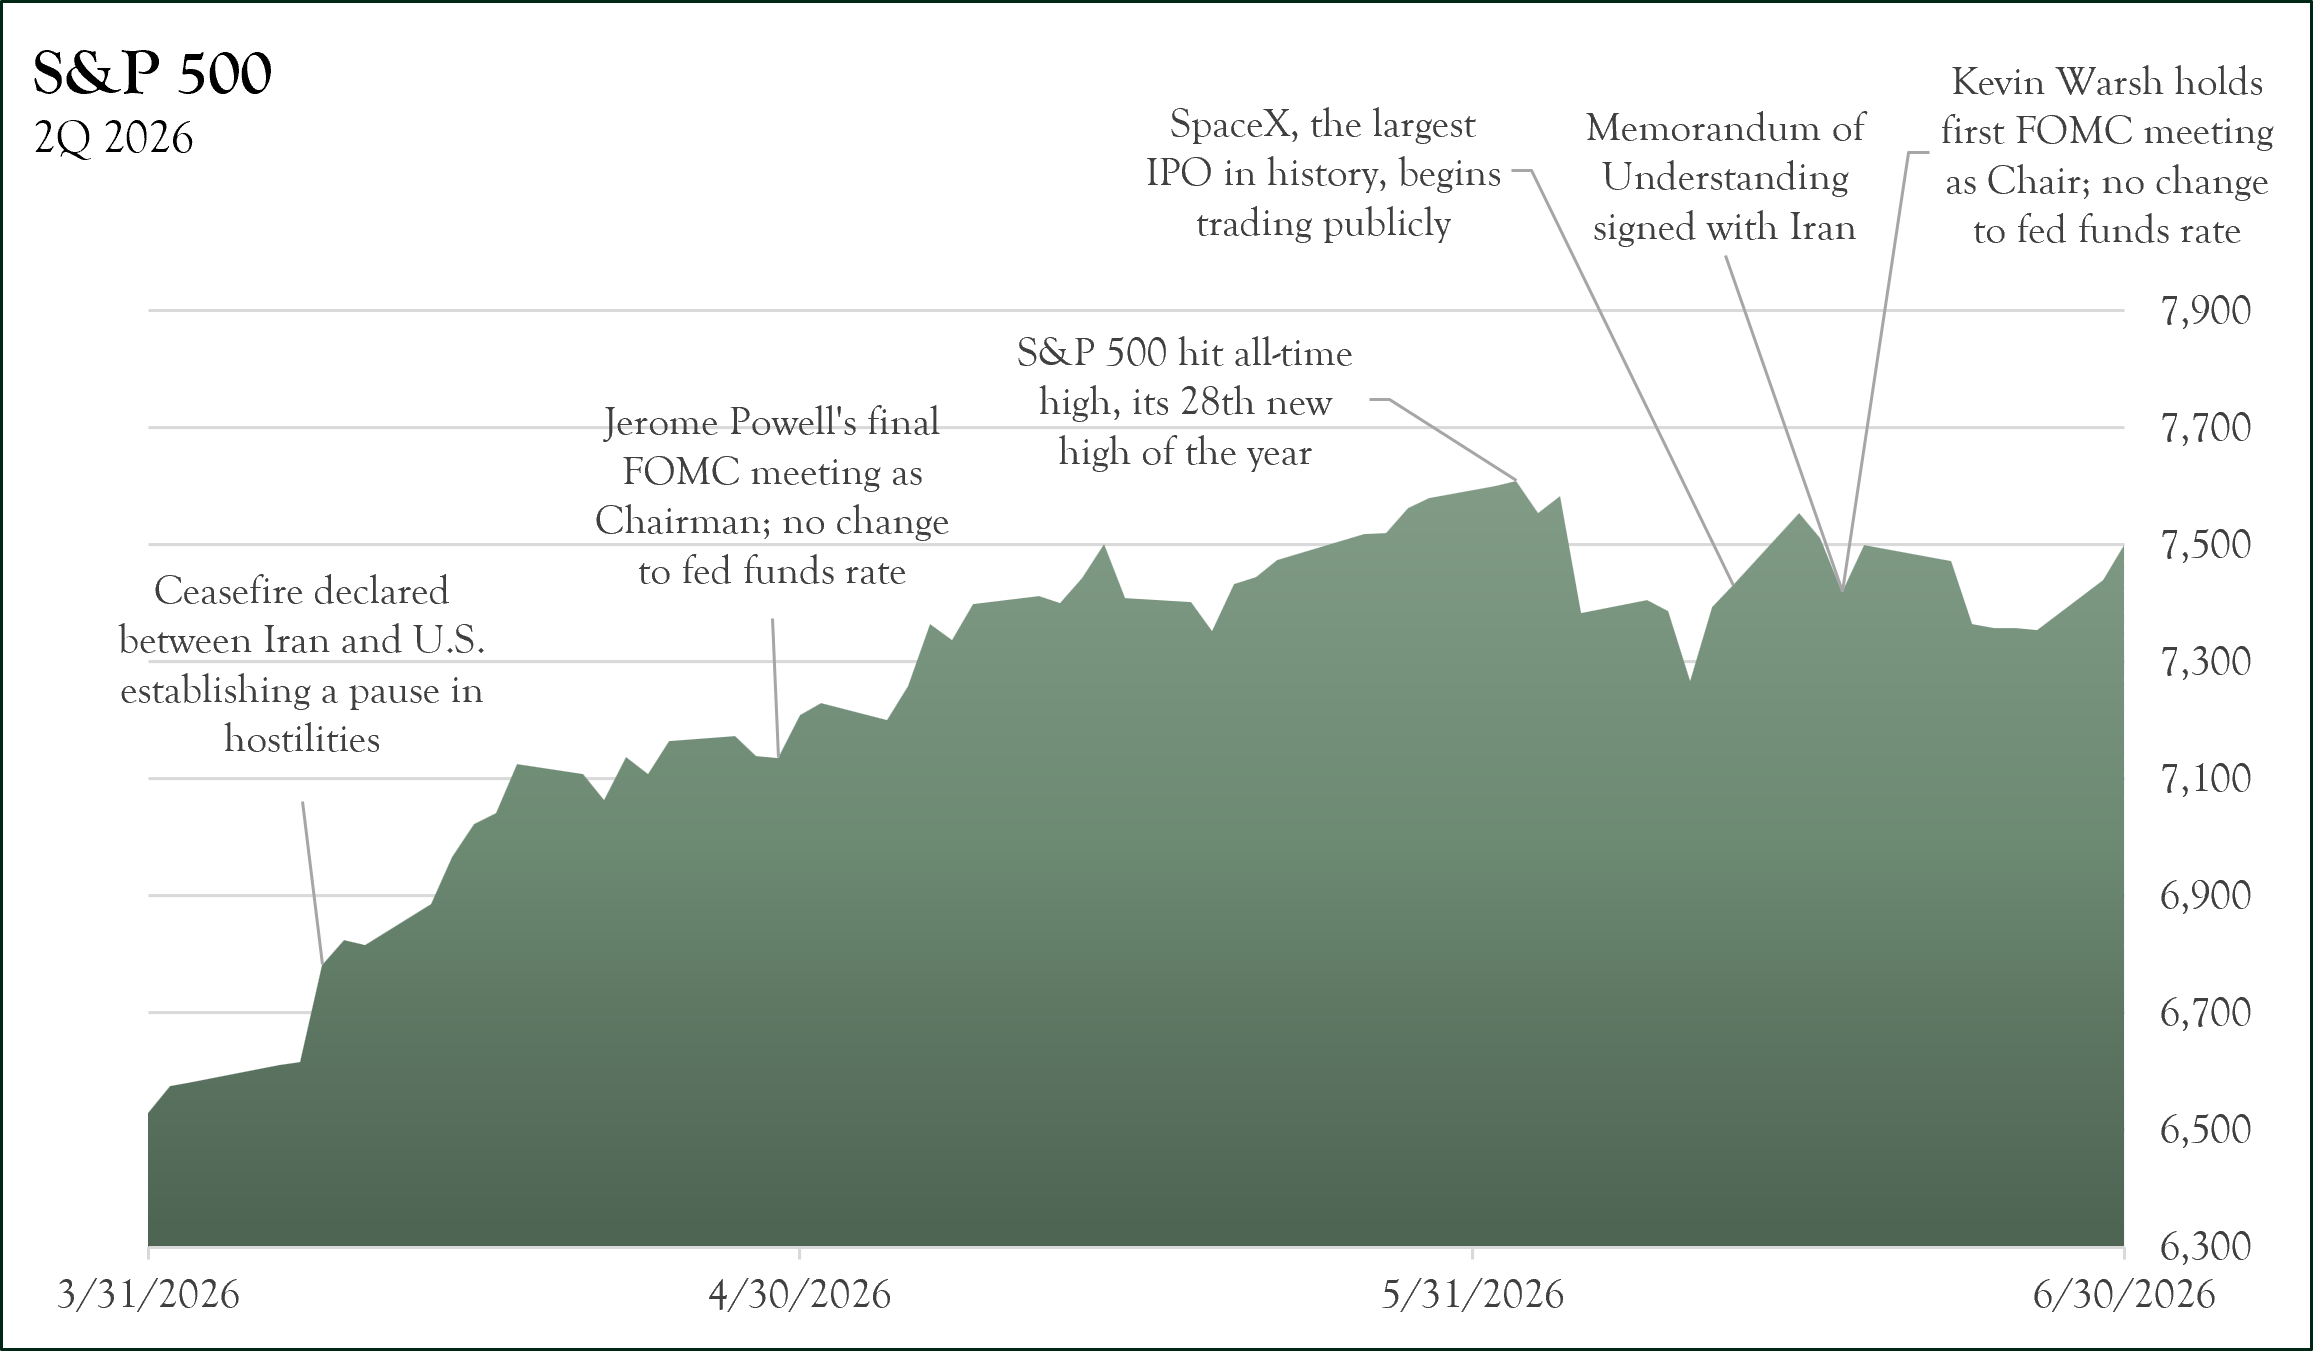
What drove the stock market?
“What’s Changed?” is a simple explanation of what happened in S&P 500 during the most recent period but does not necessarily explain why the market moved. Let’s explore the “why” by looking at three individual components that shape market changes.
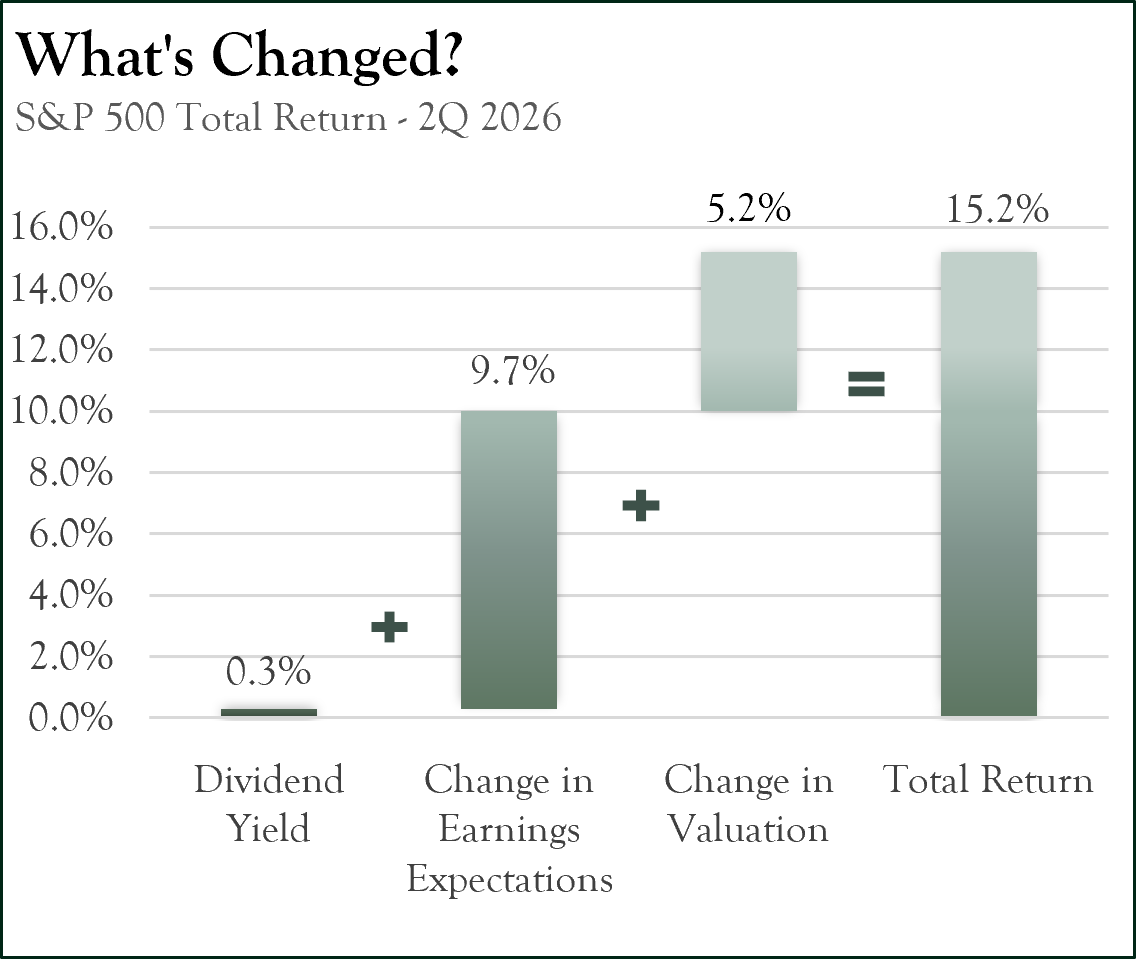

Dividend Yield: The most stable of the three factors. Dividend yields were approximately +0.3% this quarter.
Change in Earnings Expectations: Over the long term, earnings drive stock prices. This quarter, earnings expectations for the next 12 months were exceptionally strong, rising by +9.7%. AI capital spending continues to spread across the economy into various sectors, helping to drive upward revisions. Notably, higher earnings expectations were more broad-based than just larger capitalization technology companies. The equal weight S&P 500 index, which de-emphasizes the importance of mega-cap technology stocks, shows similarly strong earnings growth of +7.2% over the next 4 quarters.
Change in Valuation: Economic expectations intially were dimmed as rising energy prices were assumed to blunt economic growth. However, this outlook quickly reversed, turning positive and driving both earnings expecations and GDP revisions higher. The P/E ratio responded quickly to this positive change, moving higher by +5.2%. While sentiment was strong, the change in valuation trailed earnings expectations, which may indicate heightened skepticism of the market. At 20.2 times earnings, we believe the market recognizes the exceptional earnings growth but is moderating its willingness to pay a premium for those earnings given the heightened level of uncertainty.
What drove the bond market?
The bond market weighed inflation fears and solid economic growth during the quarter. Energy-driven inflation expectations and a solid labor market forced the Federal Open Market Committee (FOMC), led by new Chairman Kevin Warsh, to reconsider a path of rate cuts to potentially rate hikes. This was reflected in the two-year Treasury Note moving higher by 38 basis points to close the quarter at 4.18%. Payrolls also continued to expand, leaving little indication of a weak economy.
While the market has yet to fully digest Warsh’s policies and communication preferences, a somewhat more hawkish stance by the new Chairman anchored investors’ belief that the Fed will do what it takes to tame inflation. This kept longer tenor notes and bonds in the 4.5% to 5.0% range, only slightly higher than at the start of the quarter.
There has also been record corporate bond issuance year-to-date. Many blue-chip companies are tapping the debt markets to fund their AI build-out. Surprisingly, the market has been able to absorb the debt with little impact on spreads. In fact, investment grade credit spreads are the lowest in 20 years – indicating little concern.
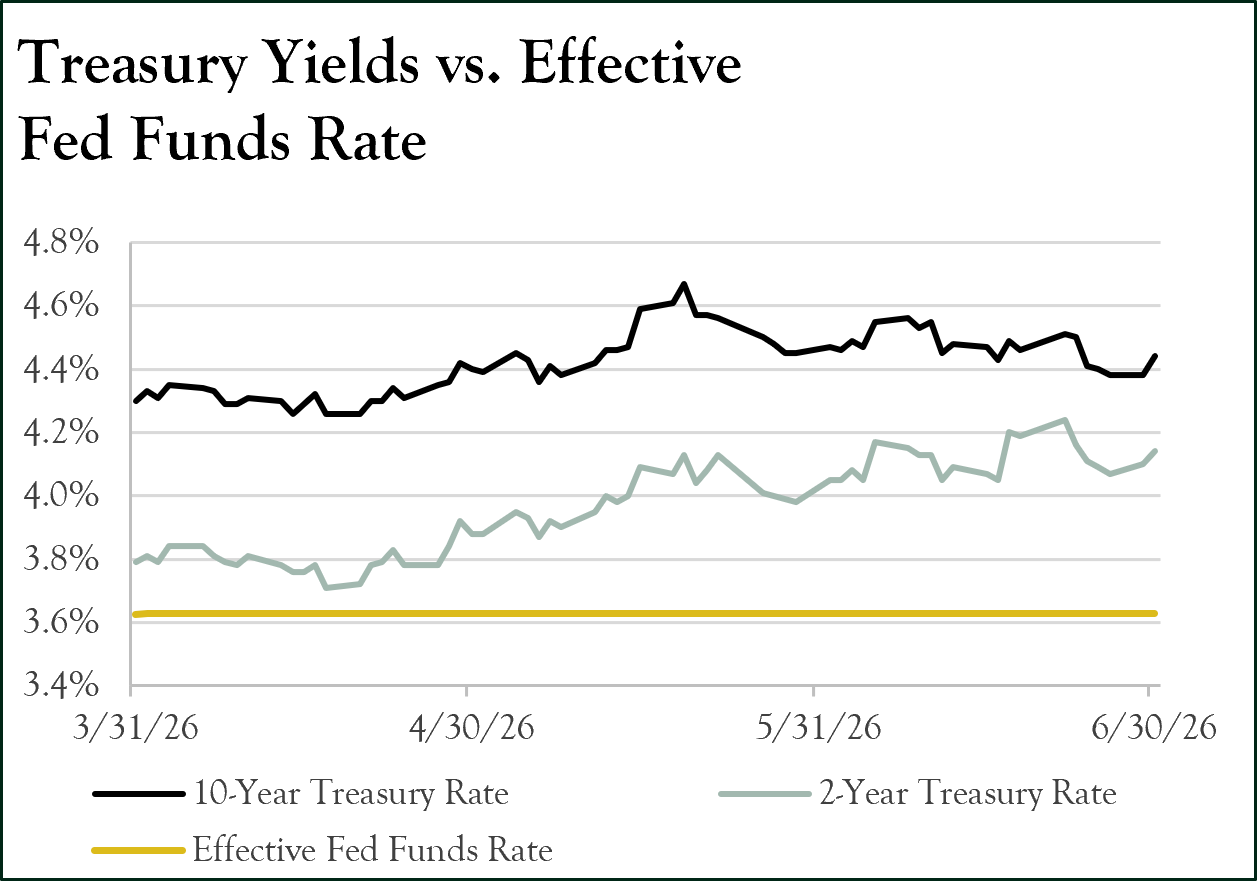
The rate of the 2-year Treasury Bill set by the market moved higher by 32 basis points to close the quarter, near 3.80%; while the 10-year Treasury Note closed the quarter at 4.32%, higher than 4.17% at year end. The market is coping with rising short-term inflation expectations and renewed concerns over government debt which is having a negative impact on prospective homeowners as 30-year mortgage rates have been rising (mortgage rates are often based on the 10-year Treasury rates).
Outlook
In his inaugural Federal Open Market Committee (FOMC) meeting, Chairman Kevin Warsh made several changes to protocol. From the content of the press release to the length of the press conference, investors were confronted with a new dynamic as the central bank appears to be less inclined to provide forward guidance as to the path of monetary policy. This may entail eliminating the Fed “dot plot” which was introduced in 2012 to provide greater transparency. While change can be difficult, it is possible that less “Fed speak” may de-emphasize the importance of the Federal Reserve and allow the markets to concentrate on economic data and market fundamentals.
The Consumer Price Index (CPI), a measure of the change in prices paid by consumers for a basket of goods and services, continues to show upward pressure. Energy, namely oil, is an important component of the consumption basket and, therefore, a significant driver of the overall index last quarter. Fortunately, oil prices are receding from the highs set back in April as a result of tempering Iran hostilities. If the ceasefire and memorandum of understanding remain in force, energy-driven inflation may well be behind us. Unfortunately, even when volatile food and energy prices are stripped out, Core CPI still prints in the mid-twos, higher than the Fed’s stated goal but more in line with Warsh’s left-of-the-decimal point mandate. (It’s the 2 that counts!) For now, it appears that the new Chair has some time to monitor inflationary forces and craft policy to address its impact. Nonetheless, investors should remain on guard for changing expectations as new and possibly divergent economic data emerges.
As a result of hotter inflationary data, consumer sentiment, as represented by the University of Michigan’s Consumer Sentiment Indicator, registered two of its lowest readings on record during the quarter. While consumers have felt pain at the pump, they have continued to spend elsewhere in the economy. While much of the wallet goes to consumer staples and other necessities, corporate earnings in more discretionary parts of the market like travel and leisure remain unusually strong. Airline passenger traffic is expected to hit a new record in 2026 and many airlines have re-affirmed their strong outlook. Unfortunately, these purchases may also be showing up in credit card data. Card balances have been steadily drifting higher over the last several years and repayment times have extended. Yet, per the New York Federal Reserve Bank data, delinquencies appear to only be returning to pre-2020 levels and not beyond. For the moment, consumers may simply be relying on short-term debt to fund gaps in living expenses but remain committed to repayment, lending credence to the belief that consumers will continue to spend as long as employment continues to be strong. This dynamic will be a problem if hiring weakens and unemployment moves upward, leaving repayment impossible. Thus far, we do not see that scenario materializing, yet we remain focused on both government and private sector payrolls.
The high inflation numbers and low sentiment readings do reveal an interesting dislocation from the equity markets that trade near all-time highs. With the historic run in the S&P 500, and individual names in particular, investors may not fully appreciate the concentration risk that now exists in portfolios. For the better part of three years, AI has been the dominant theme, with earnings and market capitalization accreting to just a few - NVIDIA’s 6% weight within a broad U.S. market index is nearly as large as the entire small-cap sector comprised of roughly 2,000 companies! In fact, nine of the top ten companies in the index are all AI-related. Furthermore, four companies are currently spending not only all their free cash flow but also issuing debt and/or equity to raise more cash in order to keep up in the race to build the infrastructure of the future. Even newly listed initial public offerings (IPO) like SpaceX (SPCX) and soon-to-be-listed Anthropic are right at the center of artificial intelligence and the spending that comes with it. Any hiccup in the efficacy or productivity of AI could have significant negative consequences on the market. Until there is a clearer picture of the return on investment of hundreds-of-billions of dollars of capital being spent, we continue to look for companies and asset classes outside of the AI trade.
There are various ways to mitigate this concentration risk in the market. One methodology in portfolios is to replace market cap-weighted strategies with equal-weighted versions of the index. Reallocating capital more evenly across the market removes the bias from the largest-of-the-large names and restructures risk into slightly smaller companies and differentiated sectors. Moving further down the market cap spectrum, one area that we are particularly interested in is U.S. middle capitalization (“mid-cap”) companies. Ranging between $8 billion and $30 billion, with larger dispersions depending on the index, mid-caps offer various benefits. To begin, mid-caps trade at 17 times forward earnings, a nearly 20% discount to their large cap brethren. Not only are mid-caps cheaper on a relative basis, the construction of the index is also a departure from the standard bearer. At a time that many are concerned about the top heaviness of the S&P 500, the mid-cap 400 index generally does not have any individual constituent that makes up more than a couple of percent. The reason for this is simple, when a company exceeds the upper limit of “mid-cap”, it graduates to a “large-cap” and is moved into the large-cap index. Unfortunately, the S&P 500 index does not have the same luxury and as a result, companies continue to grow at the top of the index with the top ten companies making up nearly 40%. Not only is the weighting of individual names important but also weighting of sectors. For instance, the technology sector represents nearly 40% of the S&P 500, something many would say is out-of-alignment with the broader economy. Meanwhile, technology only comprises 17% of the mid-cap index, allowing other sectors of the real economy like financials and industrials a 13% and 25% share, respectively. With the ink expended here and elsewhere on the benefits from OBBBA, we see wind-at-the back of smaller, “real economy” companies in the U.S. that should benefit from near-shoring and re-positioning of supply chains.
Outside the U.S., markets are similarly ebullient. Developed markets responded to improving Iranian headlines and easing oil prices to match U.S. returns. Assuming peace negotiations lead to some conclusive and sustainable outcome, we see these markets continuing to perform. As stated in previous quarterly letters, the structure of international developed markets has many differences with the U.S. market, some good and some not so good. But as it relates to portfolio construction, it is best to think of these holdings as diversifiers and less all-or-nothing trades. However, one potential headwind for U.S. investors when considering an international allocation is the continued strengthening of the dollar, which may put a lid on returns. With the Fed on hold and potentially considering rate hikes in the future, there is potential for more strengthening of the dollar relative to other currencies. Until there is a clearer understanding of the new Fed, we remain comfortable with our current allocation.
A potentially more fascinating and more treacherous allocation is emerging markets (EM) which bested the U.S. large cap market by nearly 10% during the quarter despite a drag from China. Most of that return was concentrated in a few countries and, more specifically, in three companies – Taiwan Semiconductor, Samsung, and SK Hynix. While debatable as to whether these companies should even be in an EM index, they have been integral to the booming AI buildout. The production of semiconductors and the more recent memory requirements of AI cannot be understated. However, this trade is now highly correlated with the U.S. tech trade and may no longer act as the diversifier it once was within the equity sleeve. We have taken action in portfolios to reduce our holdings of these names and further diversify our tech exposure. Time will tell if this was a prudent action, but it does serve as a reminder of the importance of knowing what you own.
As we enter the second half of the year, investors are faced with many of the same unresolved issues from the first half along with new hurdles. While inflation remains above target and monetary policy is likely to remain data dependent, equity markets will need to navigate mid-term elections which could impose gridlock in Washington. Many companies in the AI buildout will need to show that a positive return on their investment is possible or face the punishment of compressing multiples. We believe this environment will reward diversification, valuation discipline, and a willingness to look beyond the market’s largest constituents for opportunities. Whether through equal-weight strategies, down market-cap equities, or selective international exposure, investors may be well served by broadening their participation. We remain focused on identifying areas where fundamentals, earnings growth, and attractive valuations provide the strongest foundation for long-term returns.
Sincerely,
Your Oarsman Capital Team